
How to Use a Graphing Calculator
You didn’t buy a fancy brick—you bought a tool. This guide shows you how to use a graphing calculator to plot functions, set the window, analyze intersections, and run basic statistics. You’ll first learn the universal steps, then see quick brand-specific notes for TI-84, Casio fx-9860GIII, and HP Prime users.
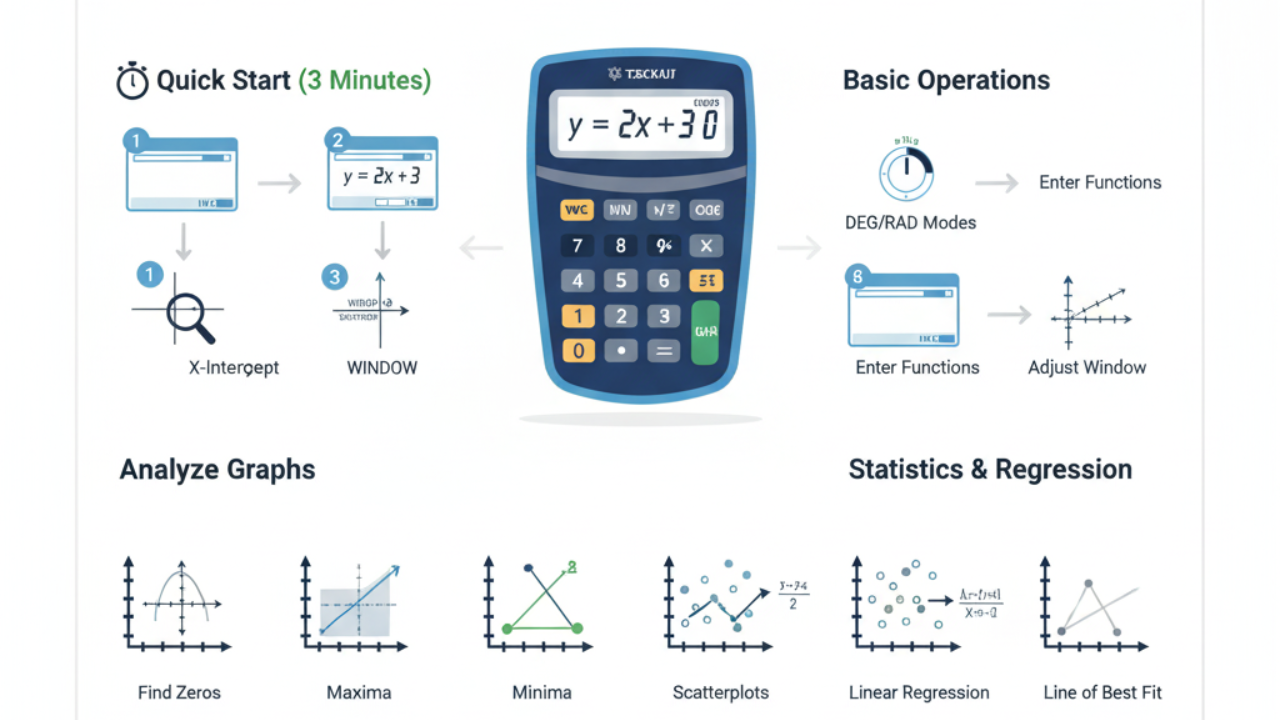
1) Quick Start: Use a Graphing Calculator in 3 Minutes
Goal: Graph y = 2x + 3, find where it crosses the x-axis, and read values.
-
Set the Mode:
-
Choose a Degree for geometry/trig classes.
-
Choose Radian for calculus or advanced trig.
-
-
Enter the Function:
-
TI-84:
Y=, then type2x+3 -
Casio:
MENU → GRAPH → Y1=2X+3 -
HP:
Apps → Function → F1(X):=2*X+3
-
-
Set the Window:
-
Start with x: −10→10, y: −10→10
-
TI:
ZOOM → ZoomStd -
Casio:
V-Window -
HP:
Plot Settings
-
-
Graph It:
-
Press
GRAPH(TI),DRAW(Casio), orPlot(HP).
-
-
Trace Values:
Use the arrow keys to move and read x, y. -
Find Zero (x-Intercept):
-
TI:
2nd → CALC → zero -
Casio:
G-Solve → Root -
HP:
Menu → Root
-
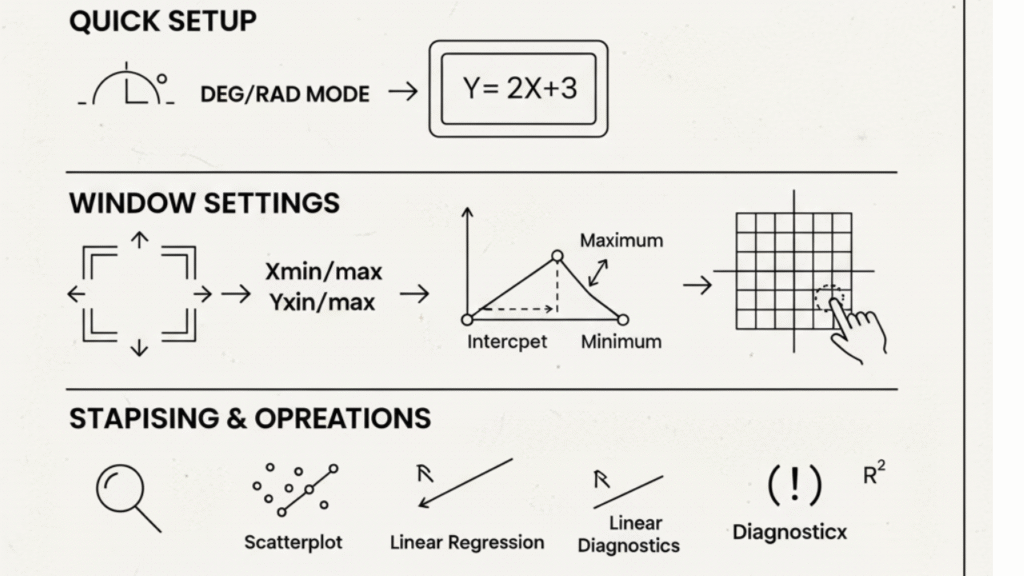
2) The Basics (What Every Model Shares)
Modes That Matter:
Always set Degree or Radian first to avoid wrong trig graphs.
Function vs Parametric vs Polar:
Select the right graph mode before entering equations.
Entering Functions:
Make sure parentheses are correct. If a curve doesn’t draw, ensure its graph style is ON (the “=” is highlighted).
Windows That Work:
Start with the standard window (- −10 to 10). If graphs look too small or are missing, use ZoomFit or manually adjust.
3) Analyze Graphs Like a Pro
Zeros (x-Intercepts):
Find where the curve crosses the x-axis.
Minimums & Maximums:
Use your calculator’s min/max function to locate extrema.
Intersections:
Use the intersect option to find where two functions cross.
These shortcuts save time on exams and homework—faster than manual algebra.
4) Tables, Trace, and Reading Domain/Range
-
Trace: Move along the curve to see (x, y) coordinates.
-
Table: View input/output pairs for any equation.
-
Domain/Range: Use the table and window to spot discontinuities or undefined points.
5) Stats & Regression (Scatterplot → Line of Best Fit)
-
Enter Data:
Add x-values in L1 and y-values in L2. -
Create a Scatterplot:
Turn Plot1 ON, select Scatter, then use ZoomStat. -
Run Linear Regression:
Use LinReg(ax+b), then store it in Y1 to see the line with your data.
To view r and r², turn Diagnostics On once in your calculator’s settings.
6) Parametric, Polar, and Piecewise Functions
-
Parametric: Switch to PAR or Param mode, define x(t), y(t), and t-range.
-
Polar: Use r(θ) format, set θ from 0 to 2π.
-
Piecewise: Use inequality or conditional templates depending on your model.
7) Brand-Specific Button Map
| Task | TI-84 | Casio fx-9860GIII | |
|---|---|---|---|
| Enter Function | Y= | MENU → GRAPH | |
| Set Window | WINDOW / ZOOM | V-Window | |
| Graph | GRAPH | DRAW | |
| Trace | TRACE | TRACE | |
| Table | 2nd → TABLE | MENU → TABLE | |
| Zero/Root | CALC → zero | G-Solve → Root | |
| Intersect | CALC → intersect | G-Solve → Intersect | |
| Min/Max | CALC → min/max | G-Solve → Min/Max | |
| Scatterplot | STAT PLOT | STAT → Graph | |
| Linear Regression | LinReg(ax+b) | STAT → CALC |
8) Exam Tips (SAT, ACT, AP, Desmos in Bluebook)
-
SAT: Bluebook has a built-in Desmos calculator. Practice with it before test day.
-
ACT: Most graphing calculators are allowed, but confirm your model.
-
AP: Rules vary by subject; always check the official list.
-
CAS Ban (2025): CAS calculators are not allowed on the SAT starting August 2025.
9) Troubleshooting Like a Pro
-
Nothing Graphs? Check if the function is ON, the mode is correct, and STAT PLOT isn’t masking the graph.
-
Domain / Invalid Dim Errors: Clear bad lists (fix L1/L2 sizes).
-
Flat or Missing Graphs: Reset to standard zoom.
-
No r/r² Values: Turn diagnostics ON once.
| Problem | Fix |
|---|---|
| Graph not showing | Check if “Y1=” is turned ON |
| Window blank | Adjust Xmin/Xmax range |
| Calculator frozen | Hold 2ND + DEL or reset |
| Graph too small | Use ZOOM → 6 (ZStandard) |
| Error: Syntax | Re-check parentheses & symbols |
10) FAQs
Q1: What’s the fastest way to learn a graphing calculator?
Set mode, enter function, ZoomStd, TRACE, then zero/intersect.
Q2: How do I find intersections?
Use the Intersect option under CALC or G-Solve and move near the crossing point.
Q3: How do I run linear regression and see r and r²?
Enter data in L1/L2, run LinReg(ax+b), and enable diagnostics.
Q4: Can I bring my calculator to the digital SAT?
Yes, but you can also use the built-in Desmos calculator.
Q5: Is this method valid for AP exams?
Yes, the process is the same; check which models are permitted.
Written by James Carter
Mathematics Educator & Graphing Calculator Specialist (2025 Edition)