
Standard deviation is one of the most important concepts in statistics. It measures the amount of variability or dispersion in a set of data points. Whether you are a student learning statistics or a professional analyzing data, understanding how to calculate standard deviation on a calculator is essential.
This guide will show you the step-by-step process of calculating standard deviation using different types of calculators, from basic models to advanced graphing calculators. We’ll also cover why standard deviation is important, how it’s applied in the real world, and common mistakes to avoid.
What is Standard Deviation?
In statistics, standard deviation is a measure that describes the amount of variation or dispersion of a set of data values. A low standard deviation means the data points are close to the mean (average) value, while a high standard deviation indicates that the data points are spread out over a wider range of values.
Why is Standard Deviation Important?
Standard deviation is used across many fields, including:
Finance: Investors use standard deviation to measure market volatility and risk.
Education: Teachers use it to understand the spread of student scores.
Health: It helps doctors understand the variability of patient responses to treatments.
Understanding how to calculate and interpret standard deviation is key to making informed decisions based on data.
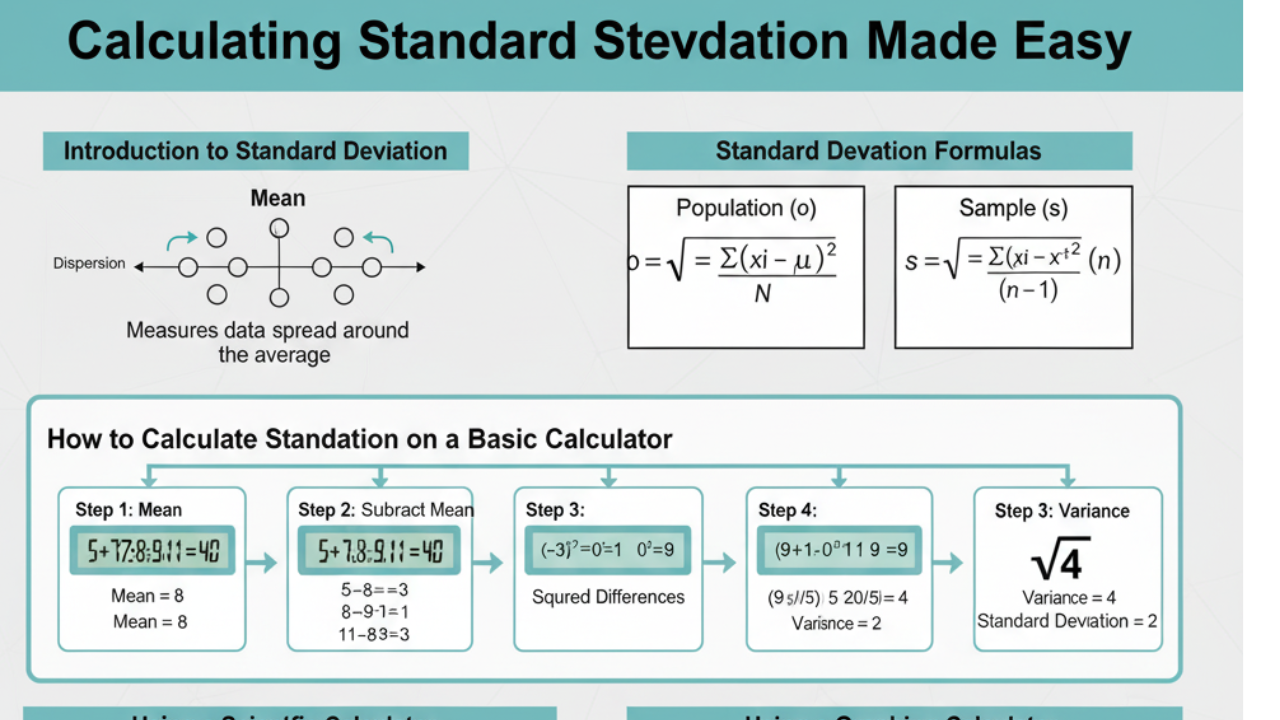
How to Calculate Standard Deviation Using a Basic Calculator
If you don’t have a scientific or graphing calculator, you can still calculate the standard deviation manually using a basic calculator. Here’s how to do it step by step:
Step 1: Calculate the Mean (Average)
To find the mean, add up all the data points and divide by the number of data points.
Mean = (5 + 7 + 3 + 6 + 8) / 5 = 29 / 5 = 5.8
Step 2: Subtract the Mean from Each Data Point
Now, subtract the mean from each of the data points. This gives you the deviation from the mean for each data point.
(5 – 5.8) = -0.8, (7 – 5.8) = 1.2, (3 – 5.8) = -2.8
(6 – 5.8) = 0.2, (8 – 5.8) = 2.2
Step 3: Square Each Deviation
Next, square each of the deviations to remove any negative values and prevent them from canceling out.
(-0.8)² = 0.64, (1.2)² = 1.44, (-2.8)² = 7.84
(0.2)² = 0.04, (2.2)² = 4.84
Step 4: Calculate the Variance
The variance is the average of these squared differences.
Variance = (0.64 + 1.44 + 7.84 + 0.04 + 4.84) / 5 = 14.8 / 5 = 2.96
Step 5: Take the Square Root of the Variance
Finally, take the square root of the variance to find the standard deviation.
Standard Deviation = √2.96 ≈ 1.72
So, the standard deviation of this dataset is approximately 1.72.
How to Calculate Standard Deviation Using a Scientific Calculator
Using a scientific calculator like the Casio fx-570MS or TI-36X Pro can simplify the process. Here’s how to calculate standard deviation using a scientific calculator:
Step 1: Enter Data into the Calculator
Press the MODE button and select STAT mode.
Choose 1-VAR for a single-variable dataset.
Input each data point followed by the = button.
Step 2: Calculate the Standard Deviation
After entering all the data points, press SHIFT and then STAT to access statistical calculations.
Select 1-VAR and press =.
The calculator will display the standard deviation (as σx for population or Sx for sample).
How to Calculate Standard Deviation Using a Graphing Calculator (e.g., TI-84)
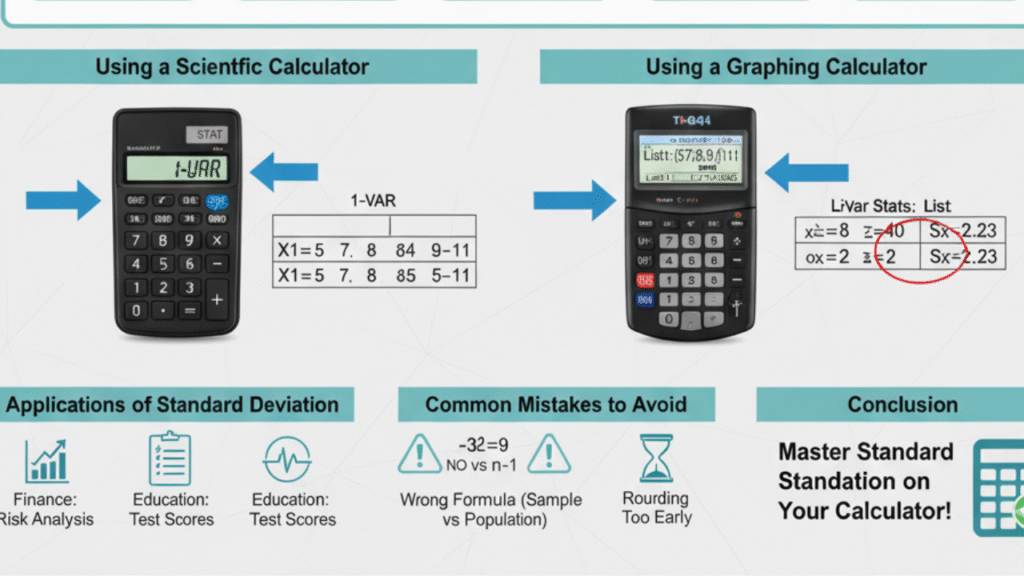
Graphing calculators like the TI-84 are even more convenient for calculating standard deviation, especially for larger datasets. Here’s how to do it:
Step 1: Enter Data into Lists
Press the STAT button and select EDIT.
Enter your data points into L1.
Step 2: Calculate the Standard Deviation
Press STAT and then select CALC.
Choose 1-Var Stats and press ENTER.
The calculator will display the mean, variance, and standard deviation (σx for population, Sx for sample).
Sample vs. Population Standard Deviation
It’s important to note the difference between sample and population standard deviation:
Population standard deviation (σ) is used when the data represent an entire population.
The sample standard deviation (s) is used when the data is a sample from a larger population.
The formulas for both are slightly different:
Population standard deviation:
Population Standard Deviation:
σ = √( ∑(Xi – μ)² / N )
Where:
σ = Population standard deviation
Xi = Each data point
μ = Population mean
N = Total number of data points in the population
Sample Standard Deviation:
s = √( ∑(Xi – X̄)² / (n – 1) )
Where:
s = Sample standard deviation
Xi = Each data point
X̄ = Sample mean
n = Number of data points in the sample
Explanation:
In the sample formula, we divide by n – 1 instead of n to correct for the bias in estimating the population standard deviation when dealing with a sample rather than the entire population.
This adjustment is called Bessel’s correction, and it helps provide an unbiased estimate of the population standard deviation.
Common Mistakes When Calculating Standard Deviation
Forgetting to square the deviations: Squaring the deviations is crucial because it ensures that all values are positive.
Using the wrong formula for sample or population: Always use the sample formula when working with sample data, and the population formula when you have complete data for the entire population.
Rounding too early: Don’t round intermediate steps; do it only at the final answer.
Conclusion
Calculating standard deviation is an essential skill in statistics, whether you are analyzing a dataset manually or using a calculator. By following the steps outlined in this guide, you can easily calculate standard deviation using a basic, scientific, or graphing calculator.
Remember to understand the difference between sample and population standard deviation, and be mindful of common mistakes to ensure your calculations are accurate.
By mastering the calculation of standard deviation, you’ll be equipped to analyze and interpret data with greater confidence and precision. Happy calculating!
Frequently Asked Questions (FAQs)
Q: When should I use the sample vs. the population standard deviation?
Use population standard deviation when your data represents the entire population, and sample standard deviation when your data is a sample from a larger population.